Explain the family of cost curves with the help of table & diagram. Or explain the classification of the cost of production with the help of schedule & diagram.
Cost of production:
The production process requires some inputs to be used. Every input has some price to be paid for. These prices are determined in the factor market. The total sum of money required for the production of a specific quantity is called cost of production.
Classification of cost of production:
- Fixed cost (F.C): -it is the cost, which does not vary with the level of output. It is the cost of fixed factors of production, which does not change, in the short run. Fixed cost includes: interest on capital, depreciation on building and fixed assets, salaries of permanent employees, rent of land etc.
- Variable cost (V.C):- it is the cost, which varies with the volume of product, directly. It increases with increase in production & decreases with the decrease in production. It includes: cost of raw material, wages of contract labor, advertisement expenses, insurance & taxes, marketing and transport etc.
- Total cost (T.C(: – it is the sum of all types of cost pf production. Total cost is made up of two components i.e. fixed cost and variable cost. So, we can write it as:
T.C = F.C +V.C
4. Average fixed cost (AFC): – when fixed cost is divided by units of output, then the cost is said to be average fixed cost.
FC
AFC =
UNITS OF OUTPUT (Q)
- Average variable cost (AVC): – when variable cost is divided by the units of output, then the cost is said to be average variable cost.
VC
AVC = —
UNITS OF OUTPUT (Q)
- Average total cost (ATC) or average cost (AC): – when total cost is divided by the units of output, then the cost is said to be average total cost or simple average cost. It is also called per unit cost
TC
ATC = —
UNITS OF OUTPUT (Q)
- Marginal cost (MC):- The net addition in total cost due to additional unit of output is called marginal cost. For example: the total cost of making one bat is Rs. 100 and the total cost of making two bats is Rs. 190.
CHANGE IN TOTAL COST <> C
MC = —
CHANGE IN OUTPUT <>Q
Then marginal cost will be 190-100 = 90. Mathematically, marginal cost is the derivative or rate of change in total cost and we can write it as
SCHEDULE SHOWING COST OF PRODUCTION:
Explanation:
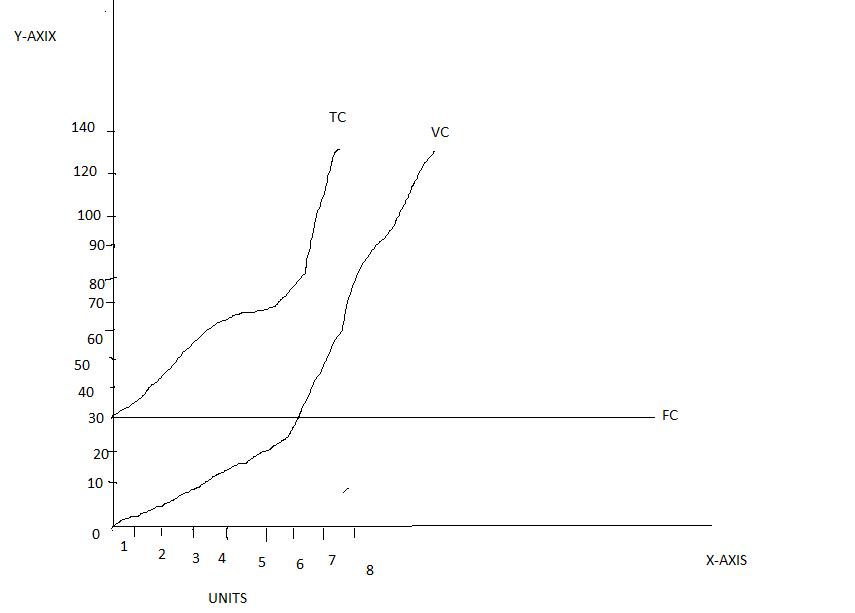
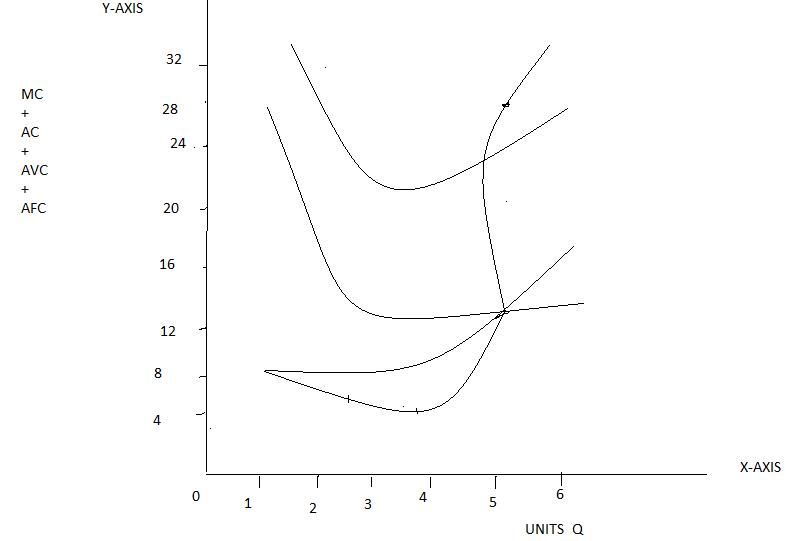
to show the costs in a diagram, we will use the data given the in the above schedule. We must remember that the marginal cost should firstly decrease & then increase with increase in output. This means that the variable cost and total cost should increase with output in such a way that the increase in cost should be less and less in the beginning and then, should be greater & greater after a point called the point of full capacity utilization. The above table shows different types of cost concept.
Fixed cost is fixed at Rs. 30 for every level of output. Variable cost varies with output and is zero at zero output level. Total cost is the summation of both fixed and variable costs. Marginal cost is the rate of change of total cost. The averages are computed by dividing the respective costs by the unit of output. Some important things can be observed here- total cost goes on increasing with output. AFC continuously decreases with output; AVC & ATC first decrease and then increase.

Figure A

Figure B
Explanation:-all the costs are plotted in fig “A” and fig “B”. the plotted curves show that variable cost and total cost vary with output in the same direction, but fixed cost is a horizontal straight line. The average total and average variable cost curve first decrease and after a point start increasing. This slope is actually the rate of change in total cost and marginal cost. The point where the curvature of total cost changes is where the marginal cost is minimum.
Unemployment in Pakistan
The output is taken along X-axis and costs on Y-axis. The cost curves plotted in the above figures reflect some properties.
Properties of cost curves:
- fixed cost is a horizontal straight line.
- total cost and variable cost curves move upwards and are parallel to each other.
- AFC curve continually falls.
- marginal cost curve must be U-shaped or hockey-shaped.
- marginal cost must intersect AVC and ATC are their respective minimum points.
conclusion:
so professor describe the words in best work because its written by Best Economist Teacher of University of the Punjab.


Comments are closed.